Understand and analyze where your store’s visitors are really coming from.
Note: This feature is part of the Almanac 2.0 navigation and is available via the Trade area data tab in the Places section.
Overview
Core trade areas help you visualize where your customers originate. This view provides dynamic coverage maps based on visit origin, enabling more strategic decisions around marketing, real estate, and local performance analysis.
By default, the map shows areas where 70% of visits originate, but you can toggle to show 30% and 50% thresholds for a more granular view.
Accessing Core Trade Areas
- Go to the Places tab in the navigation bar.
- Select a store you want to analyze.
- Open the Trade area data tab to load the default map view.

Working with Trade Area Visualizations
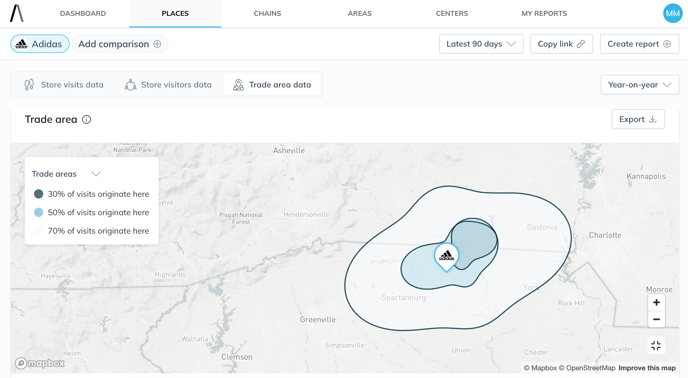
Once loaded, you'll see concentric zones overlaid on the map, representing trade areas where:
- 30% of visits originate (darkest shade)
- 50% of visits originate
- 70% of visits originate (lightest shade)
You can switch between these thresholds using the dropdown menu. The view updates accordingly.
Additional controls include:
- Switch between views: Home Zip codes, Census Block Groups


- Export: Map as image or CSV

- Fullscreen mode: Expand the view for better visibility

Use Cases
- Performance benchmarking: Identify the store's true geographic reach.
- Real estate planning: Evaluate local market coverage to guide location decisions.
- Marketing strategy: Target the neighborhoods contributing most to store foot traffic.
Tip: Use 30% or 50% thresholds to zoom in on your most loyal customer base and uncover high-intensity trade zones.
Additional Notes

- A note icon appears on the map to show the data range (e.g., Q1 2025).
- Trade area data is derived from visit origin analysis.
- Center or market views are not supported and will show an empty state.