See exactly where your store’s customers live and how they’re distributed across zip codes.
Note: This feature is part of the Almanac 2.0 navigation and is available under the Trade area data tab in the Places section.
Overview
The Home Zip Codes view shows where your store’s visitors live — letting you analyze your reach at a zip-code level. It helps you understand which neighborhoods your traffic comes from, and identify areas of opportunity or loyalty.
The map highlights visitor density by zip code using color-coded shading. Each range shows what percentage of total visitors originate from a specific zip.
Accessing Home Zip Code Data
- Go to the Places tab in the navigation bar.
- Select a store you want to analyze.
- Open the Trade area data tab.
- Use the dropdown to switch to Home Zip codes.

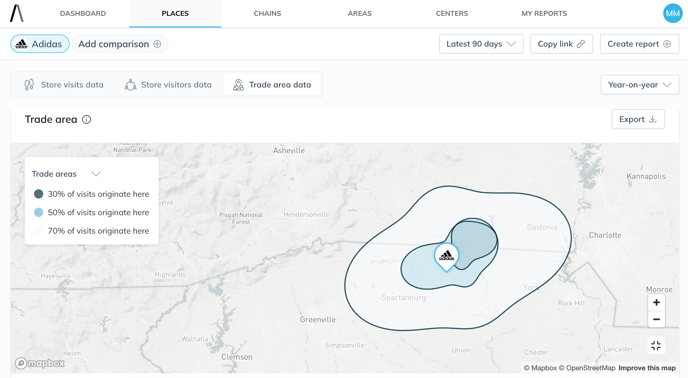

Interpreting the Map
Once selected, the map displays shaded zip code areas representing the percentage of visitors who live in each location. The darker the shade, the more traffic the store receives from that area.
You can hover over any zip code to see:
- The zip code and neighborhood name
- The exact share of traffic it contributes

Available Tools
- Switch between trade area views: Core Trade Areas, Census Block Groups
- Export: Map as image or CSV
- Fullscreen mode: Expand the view for better analysis


Use Cases
- Hyperlocal marketing: Target top-contributing zip codes with digital ads or outreach.
- Site planning: Identify areas where high shopper density suggests potential for new stores.
- Customer analysis: Understand local loyalty and compare with sales or CRM data.
Tip: Use this view in tandem with Core Trade Areas to balance origin volume (zip codes) with concentration intensity (trade area %).
Additional Notes

- A note overlay shows the time period the data covers (e.g., Q1 2025).
- Data is based on visit origin and is updated monthly.
- If you're in a Center or Market view, this feature will show an empty state.